BI trends for equipment rental and leasing
 Michiel Toppers
Table of contents
Equipment-driven organizations need to make innovation buzzwords relevant for their organization. As a result, we’ve written alot about the importance of “being a data-driven organization”. And also what it means for your company to achieve complete insight for operations. Just having your focus on this topic can increase your insight.
For example mobility, Big Data, Cloud, Internet of Things—they’re all part of it. Hence, the driving force behind this is business intelligence. Especially business intelligence that is available at the operational level. For this article, we’ll dip a toe into the world of Power BI for equipment-driven companies. Furthermore, we take a look at graphical dashboards for services, transport, and resource planning.

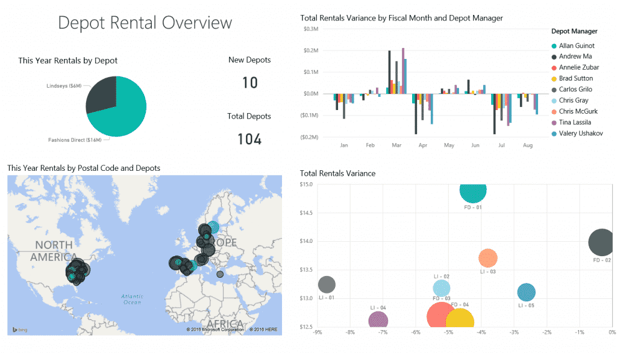
Image 1: Depot rental overview in DynaRent PowerBI
Planning dashboards gather and organize information from all areas of your organization. From your ERP sytem to mobile devices and even third-party interfaces. In this case, we will look at immediate strategies for efficient processes. For example, a transport planning board might hook into:
- Fulfillment orders for shipping, fully processed and organized, automatically analyzed for optimal staging and transport mode, that come from back-office, customer websites, third-party dealers, and the like.
- Visibility into real-time warehouse processes for pick-pack-assembly and built-in ability for transport and logistics to collaboratively manage by exception.
- Internal and third-party carrier information drawn directly from third-party interfaces.
- Resource availability and granular details essential to meeting needs for timing, compliance with regulations, delivery requirements, etc.
- Workflow-driven transport orders that originate in the back office and automatically populate with information and documentation specific to customer agreements, equipment, inspection and service requirements, etc.
- Integration with TomTom and Webfleet apps used by drivers to receive work orders and communicate in real time with planning.
- Action management that ensures all processes and information move in the correct sequence and everyone “does the right thing right” with relevant steps and communications—from drivers to back-office to outside entities.
What users work with is a graphical UI that offers visual overviews, drill-back, and drag-and-drop capabilities, plus quick access to information and communications management. What’s behind the board?
A humming matrix of data integration and configuration that draws and filters information from a vast array of sources, then presents it so that it’s instantly relevant, always current, and ready for further queries and analysis. Users know “what’s happening” the way they want and can work proactively to optimize delivery days, hours, or minutes in advance, or respond immediately to issues without disrupting operations. If you combine already-rich capabilities in rental, leasing, and services software with Power BI tools, data silos will simply vanish. Consequently there won’t be barriers between your business system infrastructure, devices, third-party and customer-facing interfaces—you name the potential connection and it can be incorporated into the tools your people work with for all rental, leasing, and services operations.

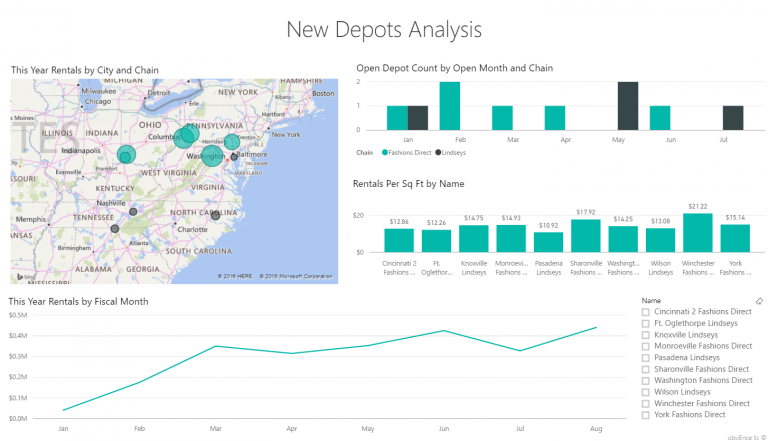
Image 2: insight for operations in DynaRent PowerBI
Insightful execution leads to insightful strategy and insight for operations
Self-service analytics for operations are a springboard for smart business strategy—literally. You’ll be continuously gathering data from operations that will surface as KPIs for best practices, customer trends, product offerings, new markets, third-party relationships, your own pace for innovation…there’s no end. We’ll be talking more about business intelligence for equipment-driven organizations over the next few weeks, so stay tuned!

